Visualize your life, the easy way
“Time is precious – but it’s not like other precious things. You can’t hold it, like a necklace. Or taste it, like money.” – Philomena Cunk
⏳ Time is hard
Your brain is bad at grasping time.
You can’t grasp the size of it; the distance between events; how long you’ve been alive; how much time you have left. You’re not evolved to. Efficiently modelling the events of the distant past – decades before – didn’t help your ancestors launch that spear more accurately or find a more delightful mate.
Pictures can help a lot to shift your mental model. When you visualize time, the spatial processing part of your brain – this is bigger than that – kicks in and suddenly you feel an intuitive grasp on the previously intangible.
Visualizations also break you out of your temporal bubble. You’re in a bubble right now: thinking about what’s for dinner, your plans for later; the next thing that’s scary or exciting; the stupid thing you said yesterday that hurts to remember. It’s helpful to shift that perspective to other time scales.
This post looks at different ways to visualize your own life, in order to get useful insight.
1. All of the time that there is
Tim Urban – creator of “the best blog on the internet,” Wait But Why – pioneered this kind of visualization, as far as I can tell.
Back in 2013 he wrote Putting Time in Perspective, breaking down the past into a series of timespans that gradually zoom out. You start with the last 24h, then the last week, the last month, and so on – back to the beginning of time (all of it). It starts like this (do click through and check out the whole thing):
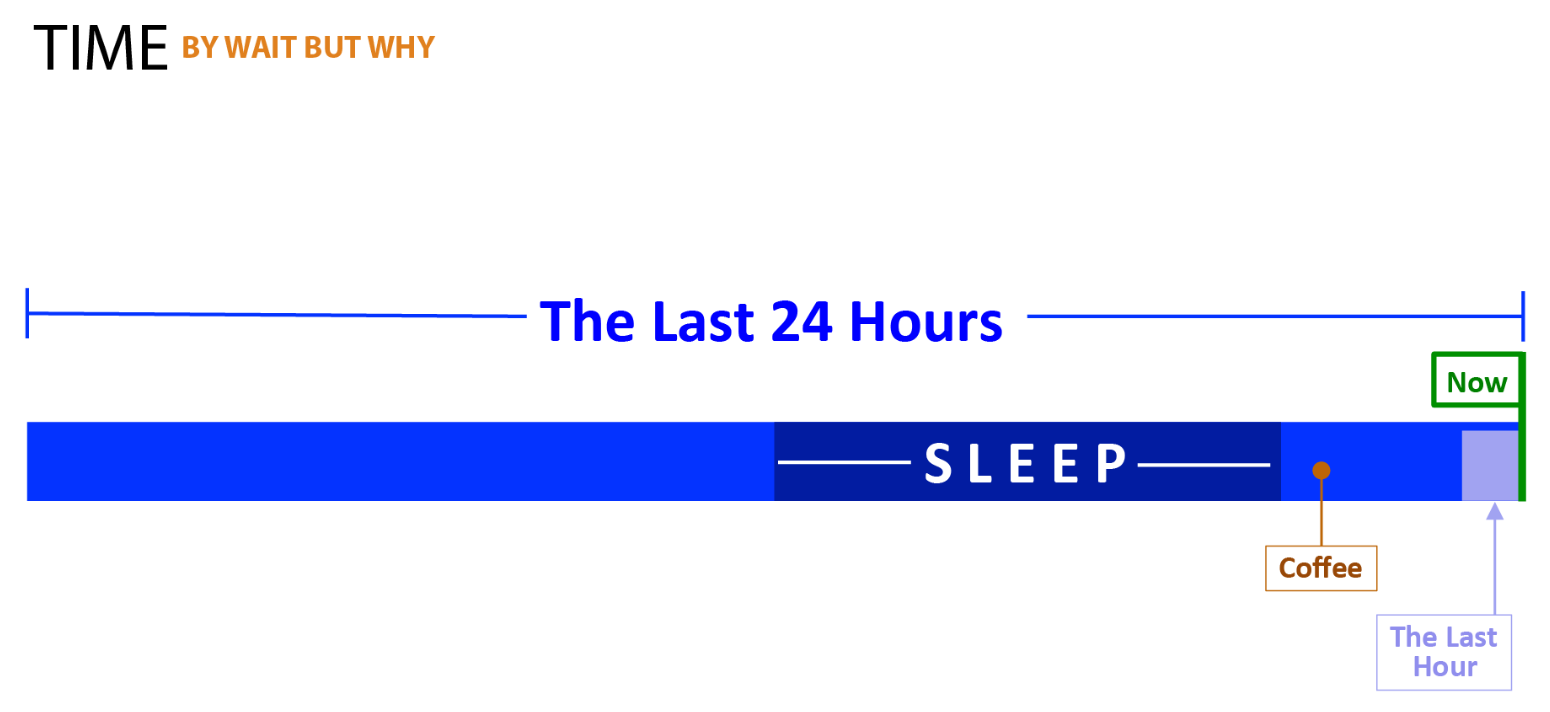
This one is good for the ultimate Big Picture™, but it’s quite impersonal (assuming you’re not a time traveller). What about you, your life?
2. Your Life in Weeks
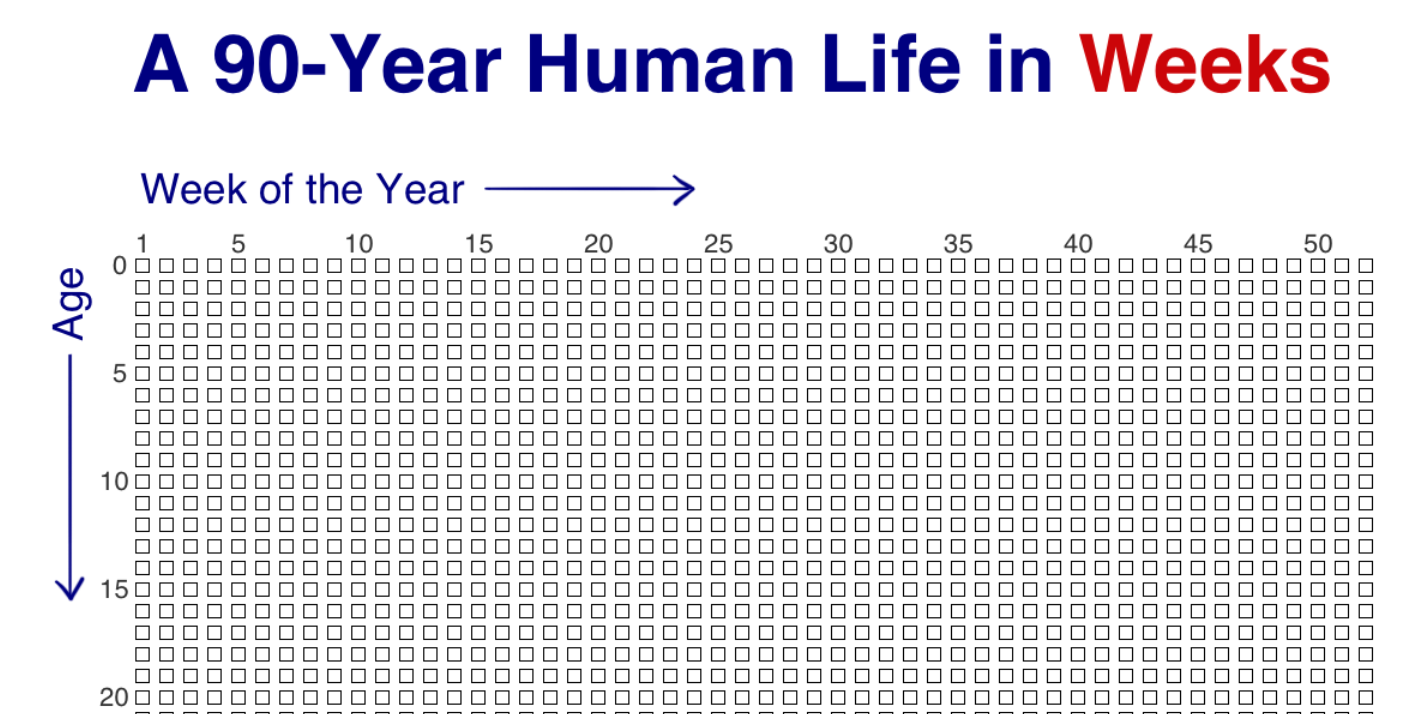
Tim’s 2014 followup Your Life in Weeks is a classic of data visualization. It’s difficult to articulate the sort of sober horror that arises when your infinite-feeling life is laid out before you in a modest set of easily-checked boxes that could comfortably fit on a single sheet of paper.
It’s a great wakeup call.
It starts like this (again, do read the real thing):
Quite a few people have taken a shot at building on this life in weeks idea.
The Overview Effect
Bryan Braun made a version that – given your birthday – colours in the boxes for you, suddenly revealing your own life in one sudden jolt of existential terror. For me, there is no doubt I am squarely past the – nnrgh – halfway line:
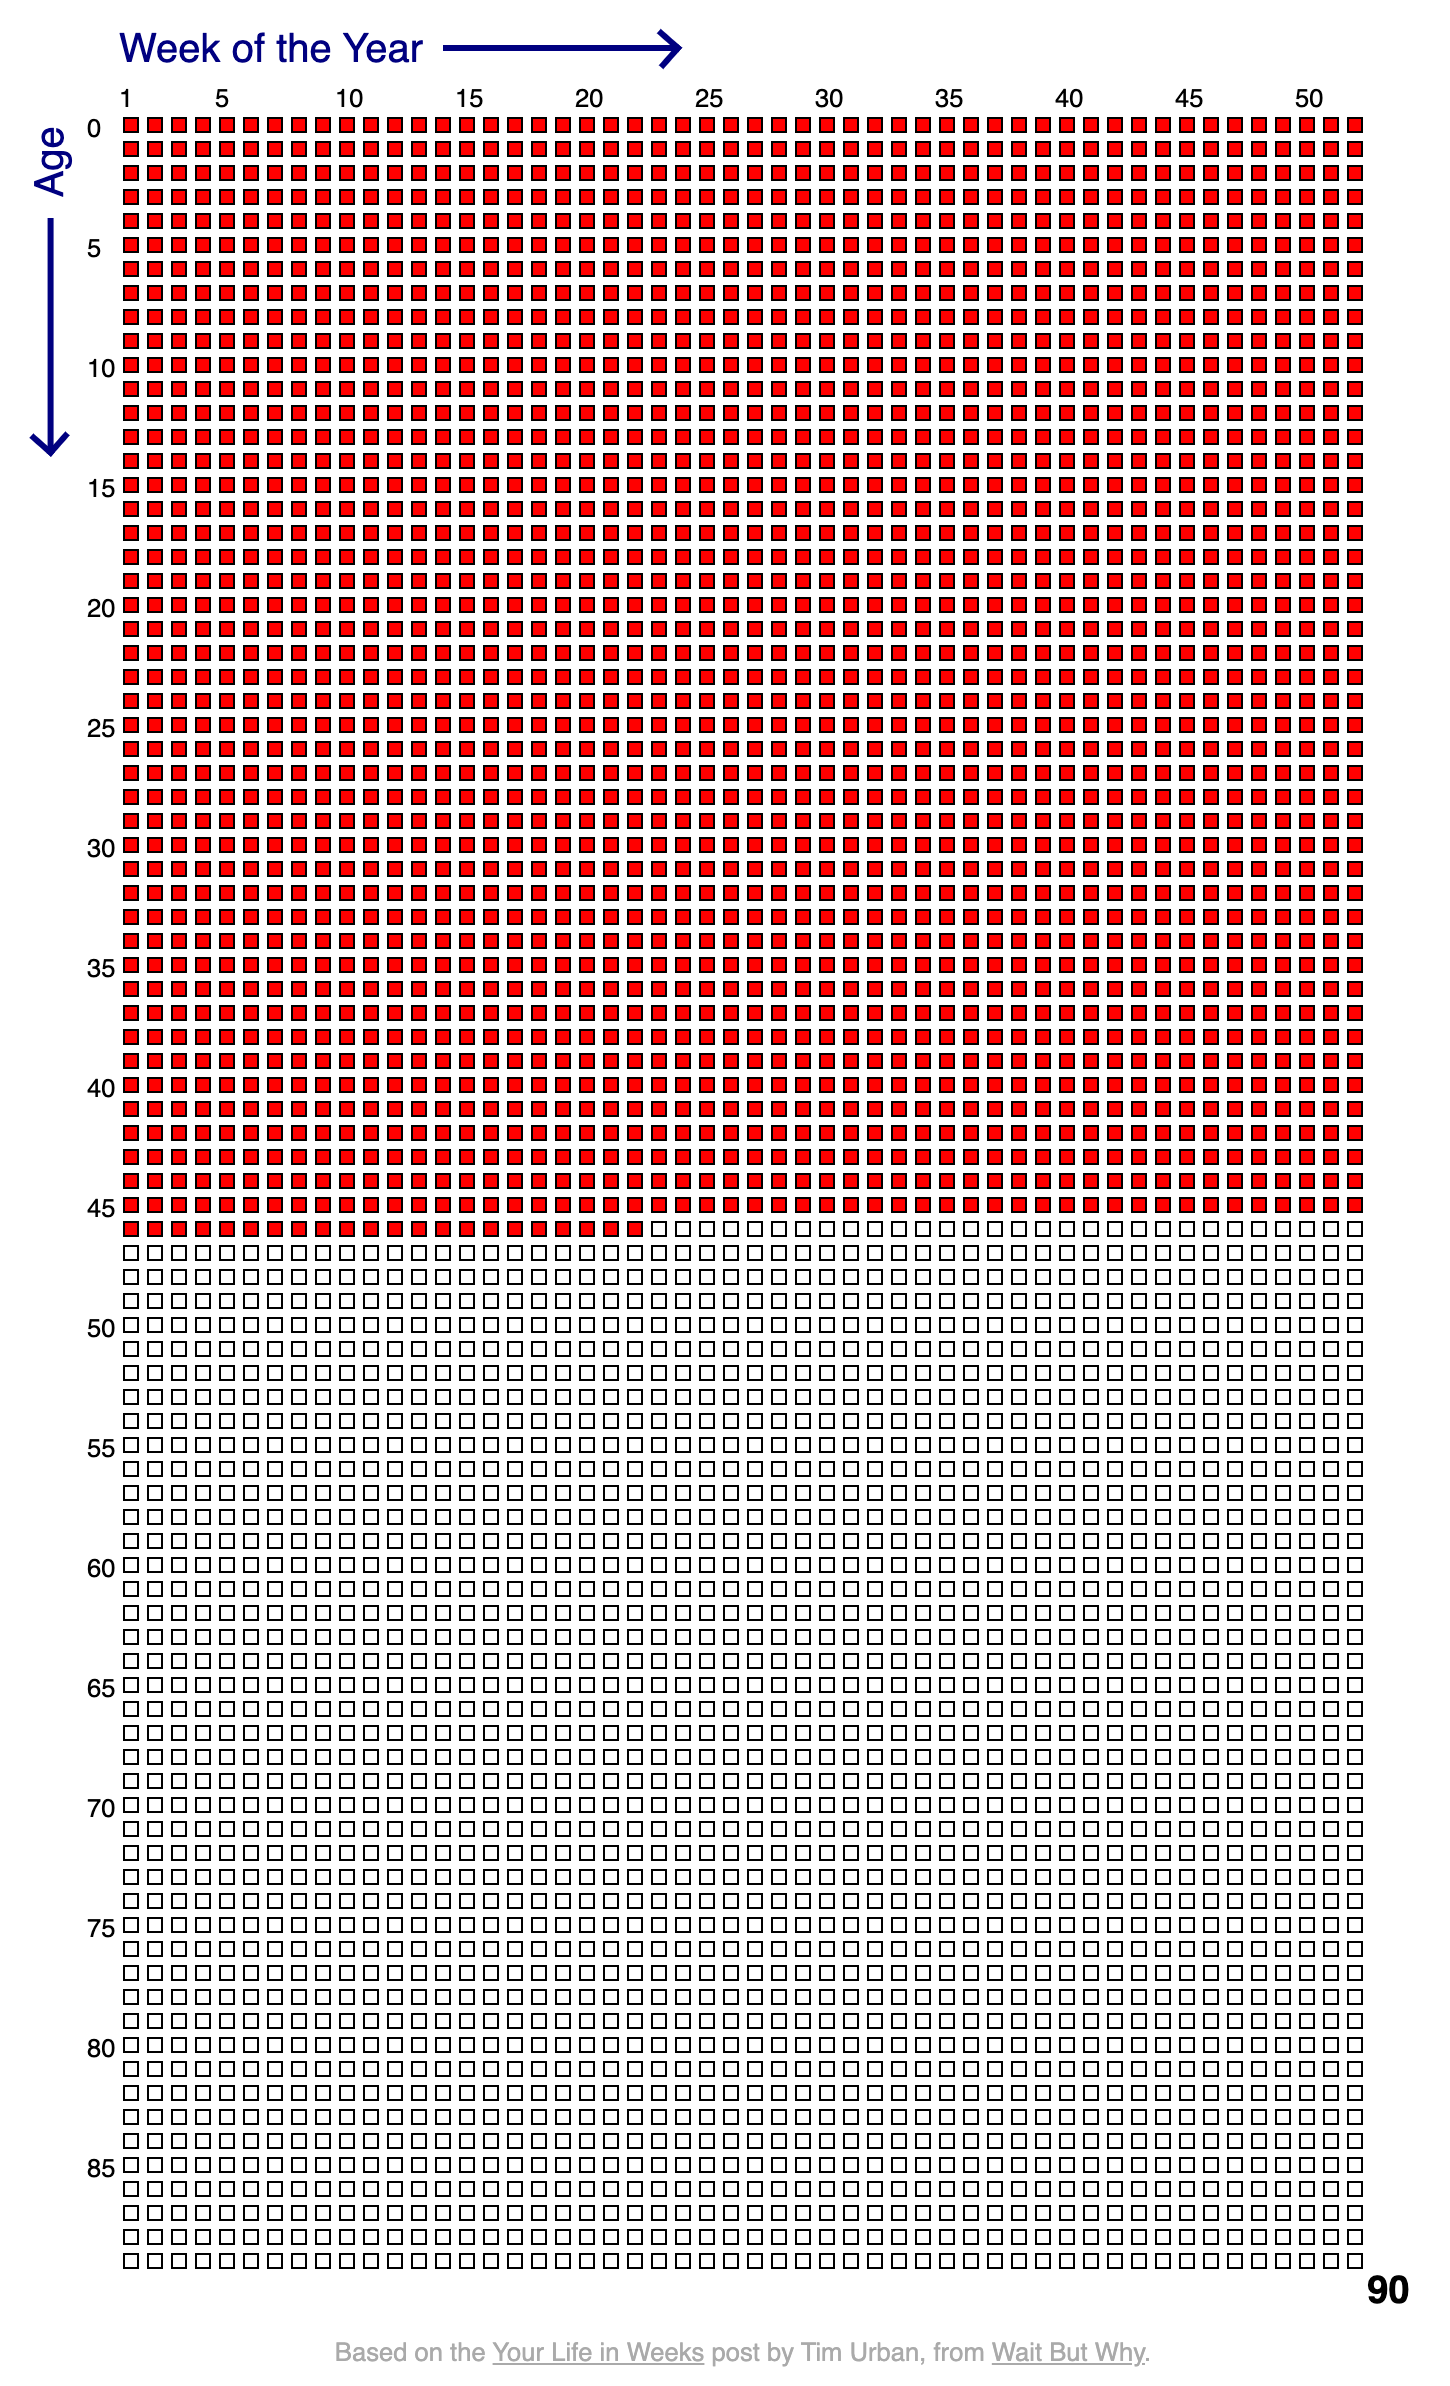
When a visual like this clicks for you, in the best case you experience a strong Overview Effect - a new perspective that’s positive, inspiring. Or maybe you feel existential dread, and a renewed urgency to check your priorities.
The Tail End
If you really want to shake up those priorities, take a deep breath, find a sturdy armchair and absorb Tim’s visualization of The Tail End. That article was adapted into an amazing video by Kurzgesagt in 2021:
These charts had a genuine impact on my life decisions. Many times now I’ve used the calculus, how many more times am I (or my kids) going to see this person? when planning how we spend our time.
Detailed life events
What about more detail?
Buster Benson has a cool version of this, where he can add tags to show when memorable things happened. He posted the source too if you want to hack your own. Buster’s chart begins like this:
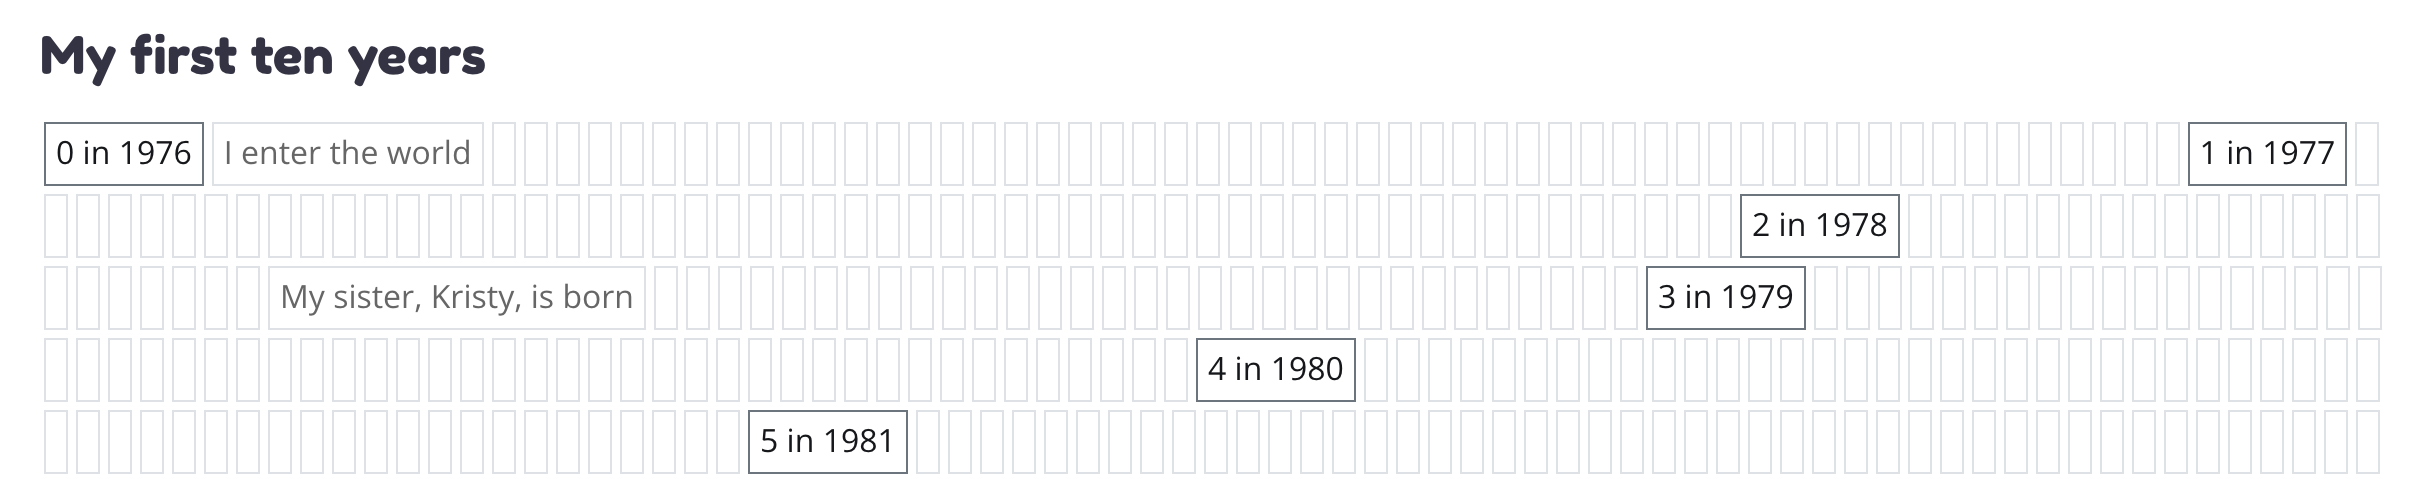
This is getting somewhere – we’re getting a sense of scale, and additionally we’re mapping our life events onto it.
Is there a simpler way?
💁♀️ An easy version
There are quite a few fancy versions of this. You could even buy a physical chart - Tim will sell you one for 20 US dollars.
All of these visualizations have one thing in common: they’re a collection of cells representing time units.
Hmm. You know what’s a fast and filthy way to visualize a bunch of ordered cells?
Mother-loving spreadsheets. Let’s go.
1. The basic timeline
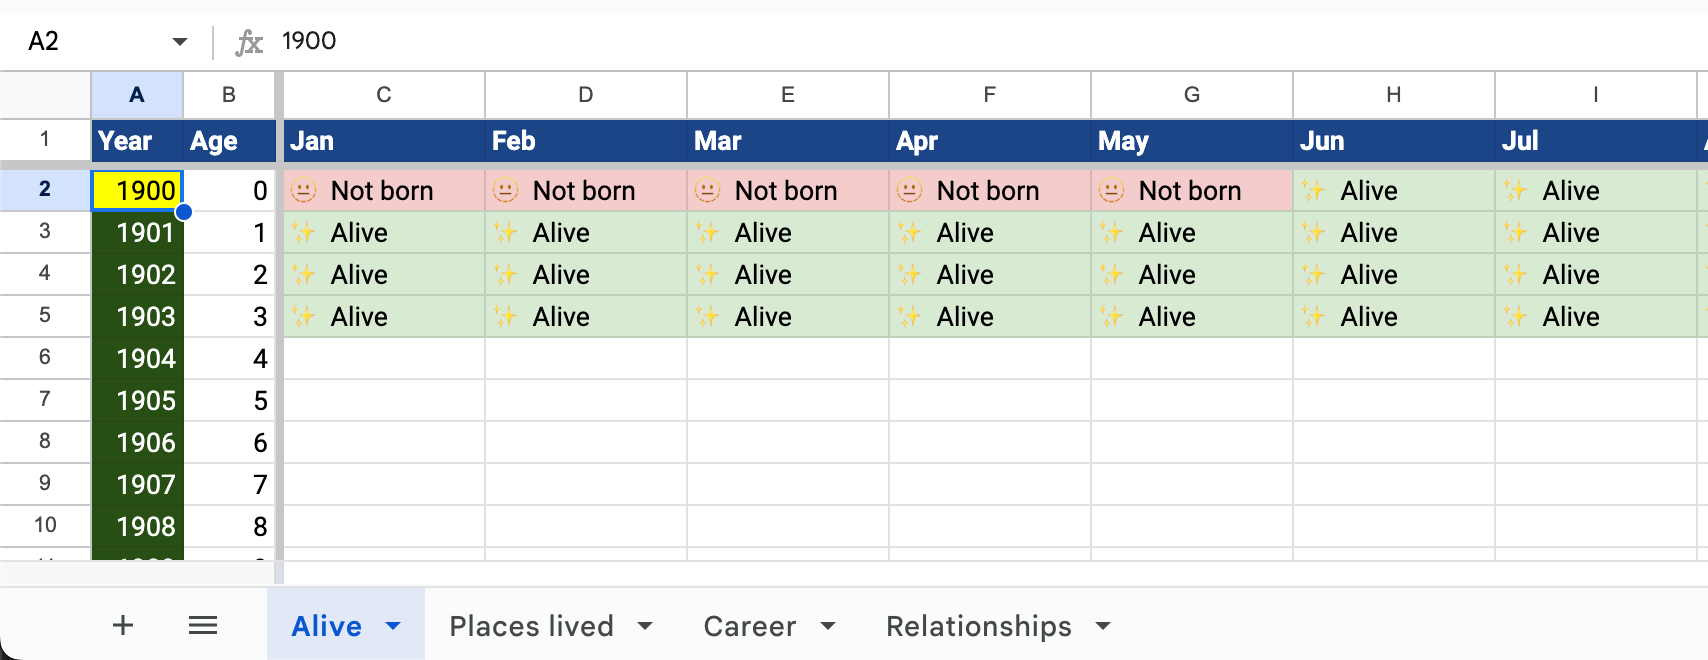
Let’s fire up Google Sheets. We’re going to use months as our time unit, since it has nice tradeoffs.
Here’s the basic readout of my life so far. Zoom in a bit if you can’t read the text:
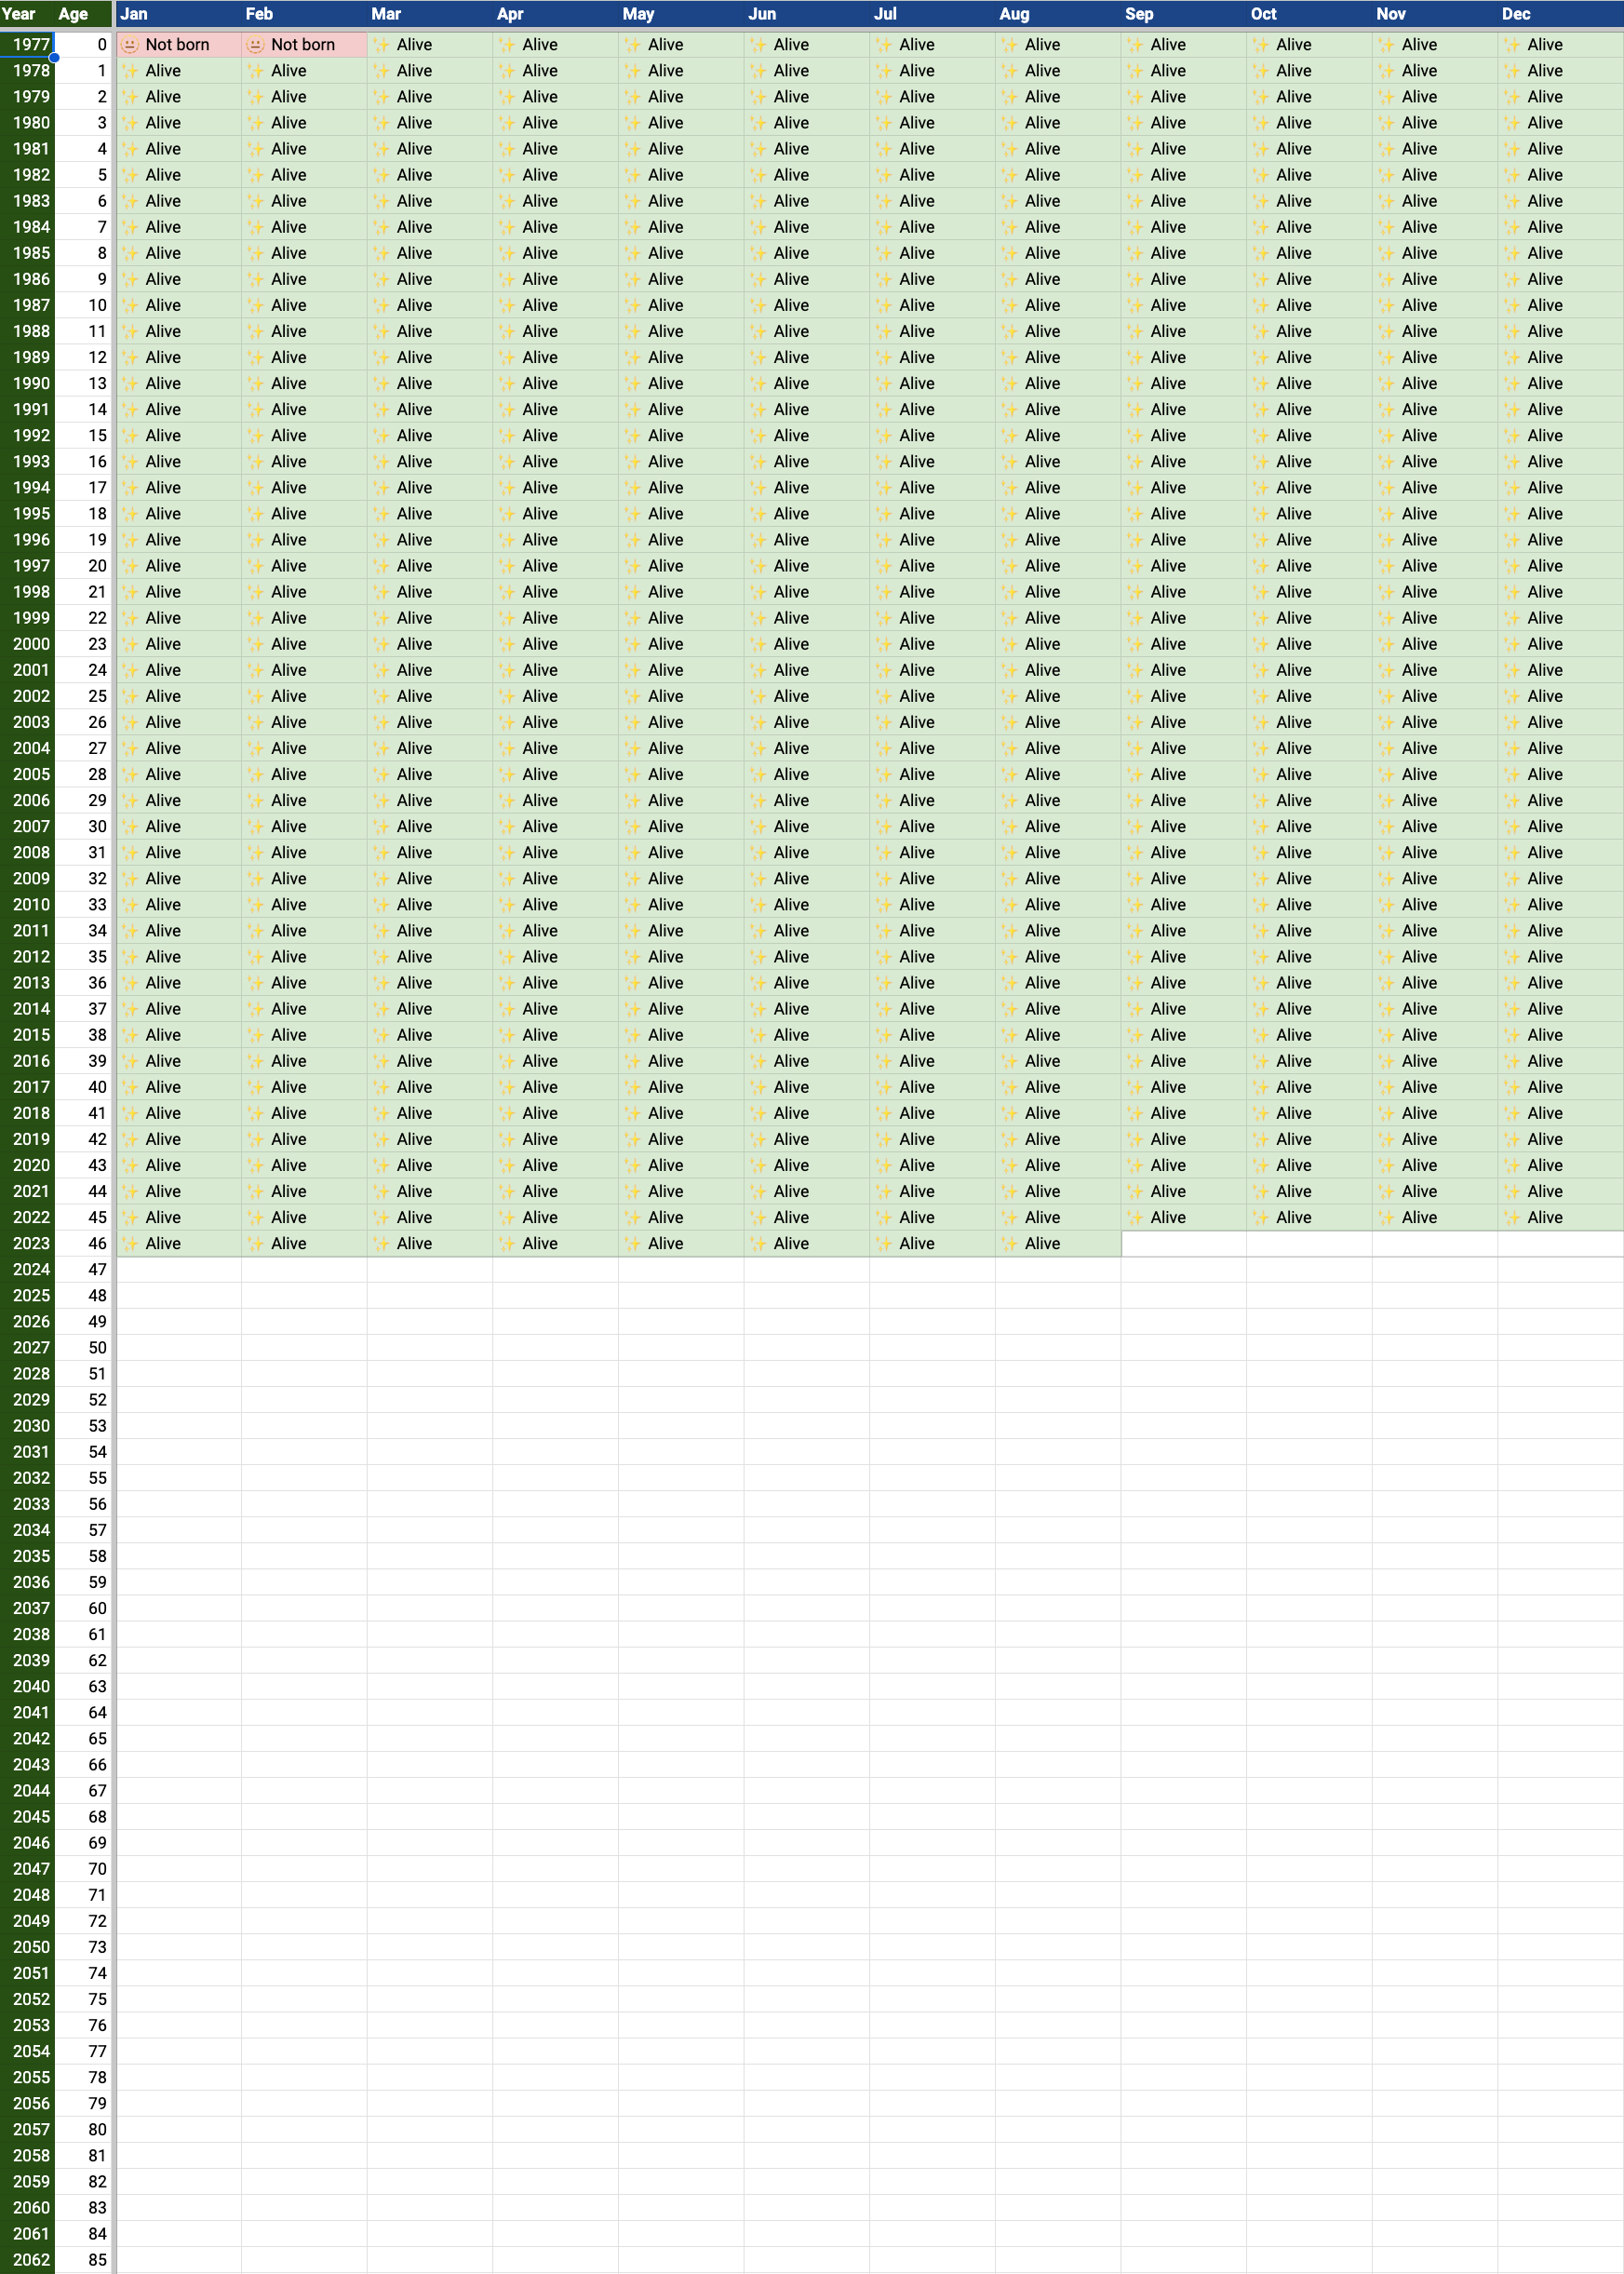
What this chart makes me think about:
- There’s that ‘halfway done’ feeling again. Phew.
- I hope you get a 🫥 Not born section on your chart. I find this binary readout very funny.
- The Not born section is kind of interesting when you consider how big that pink section would be if we scrolled up before 1977 – and further up, and further…
It’s a good start. What else can we visualize?
One thing I noticed is that these charts work best to capture long, continuous events. Points-in-time get kind of fiddly – it’s difficult to show their detail without messing up the flow of the chart.
Here are four kinds of continuous event I found interesting.
2. Places you’ve lived
Here’s everywhere I’ve lived so far. I’ve clipped out the blank cells for this, we’re not comparing the past to the future any more.
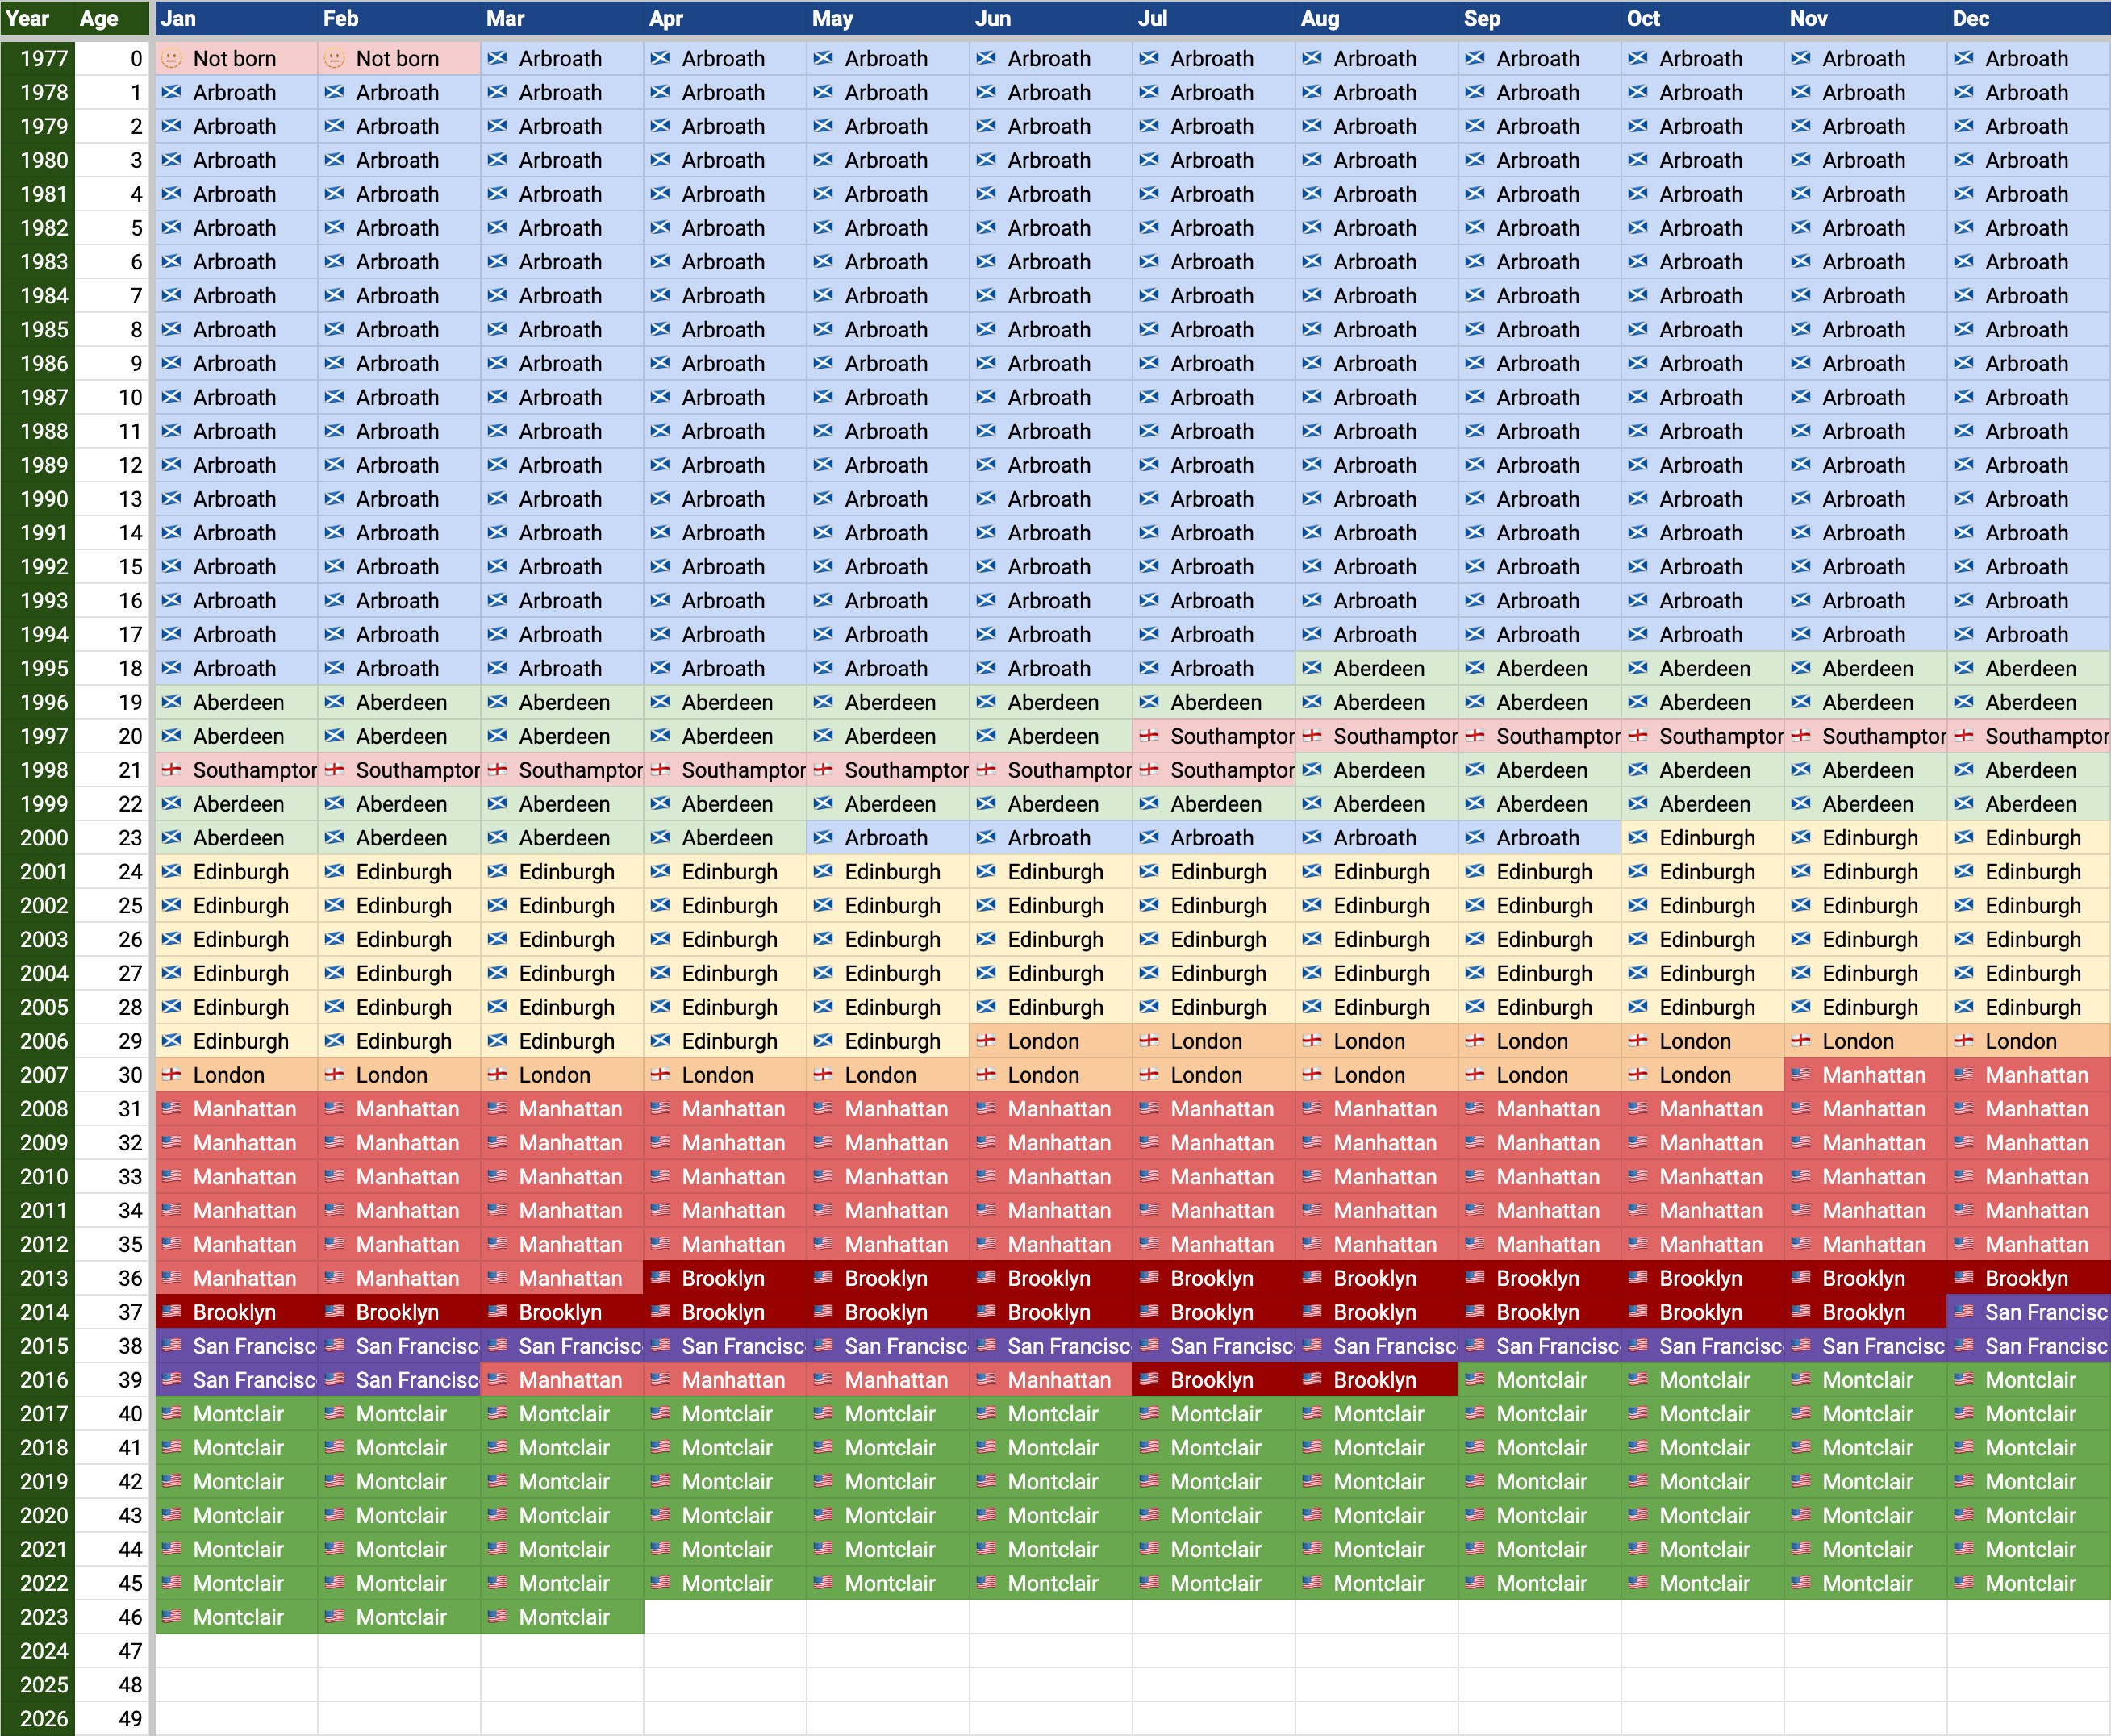
What this chart makes me think about:
- There’s a lot of light blue. If you move from home, it’s hard to accumulate anywhere near as much time in other places! Chances are, the place you grew up had a massive effect on you.
- Future me in 2023 is pretty horrified that I spent so many formative years in Aberdeen and Southampton. Not places I would choose today. But then: every choice I made, every place I lived, led me to today. That 1997 internship in Southampton – however much I disliked living there – was pivotal. It pointed me in a new direction.
Talking of which…
3. Your career so far
What about our places of work?
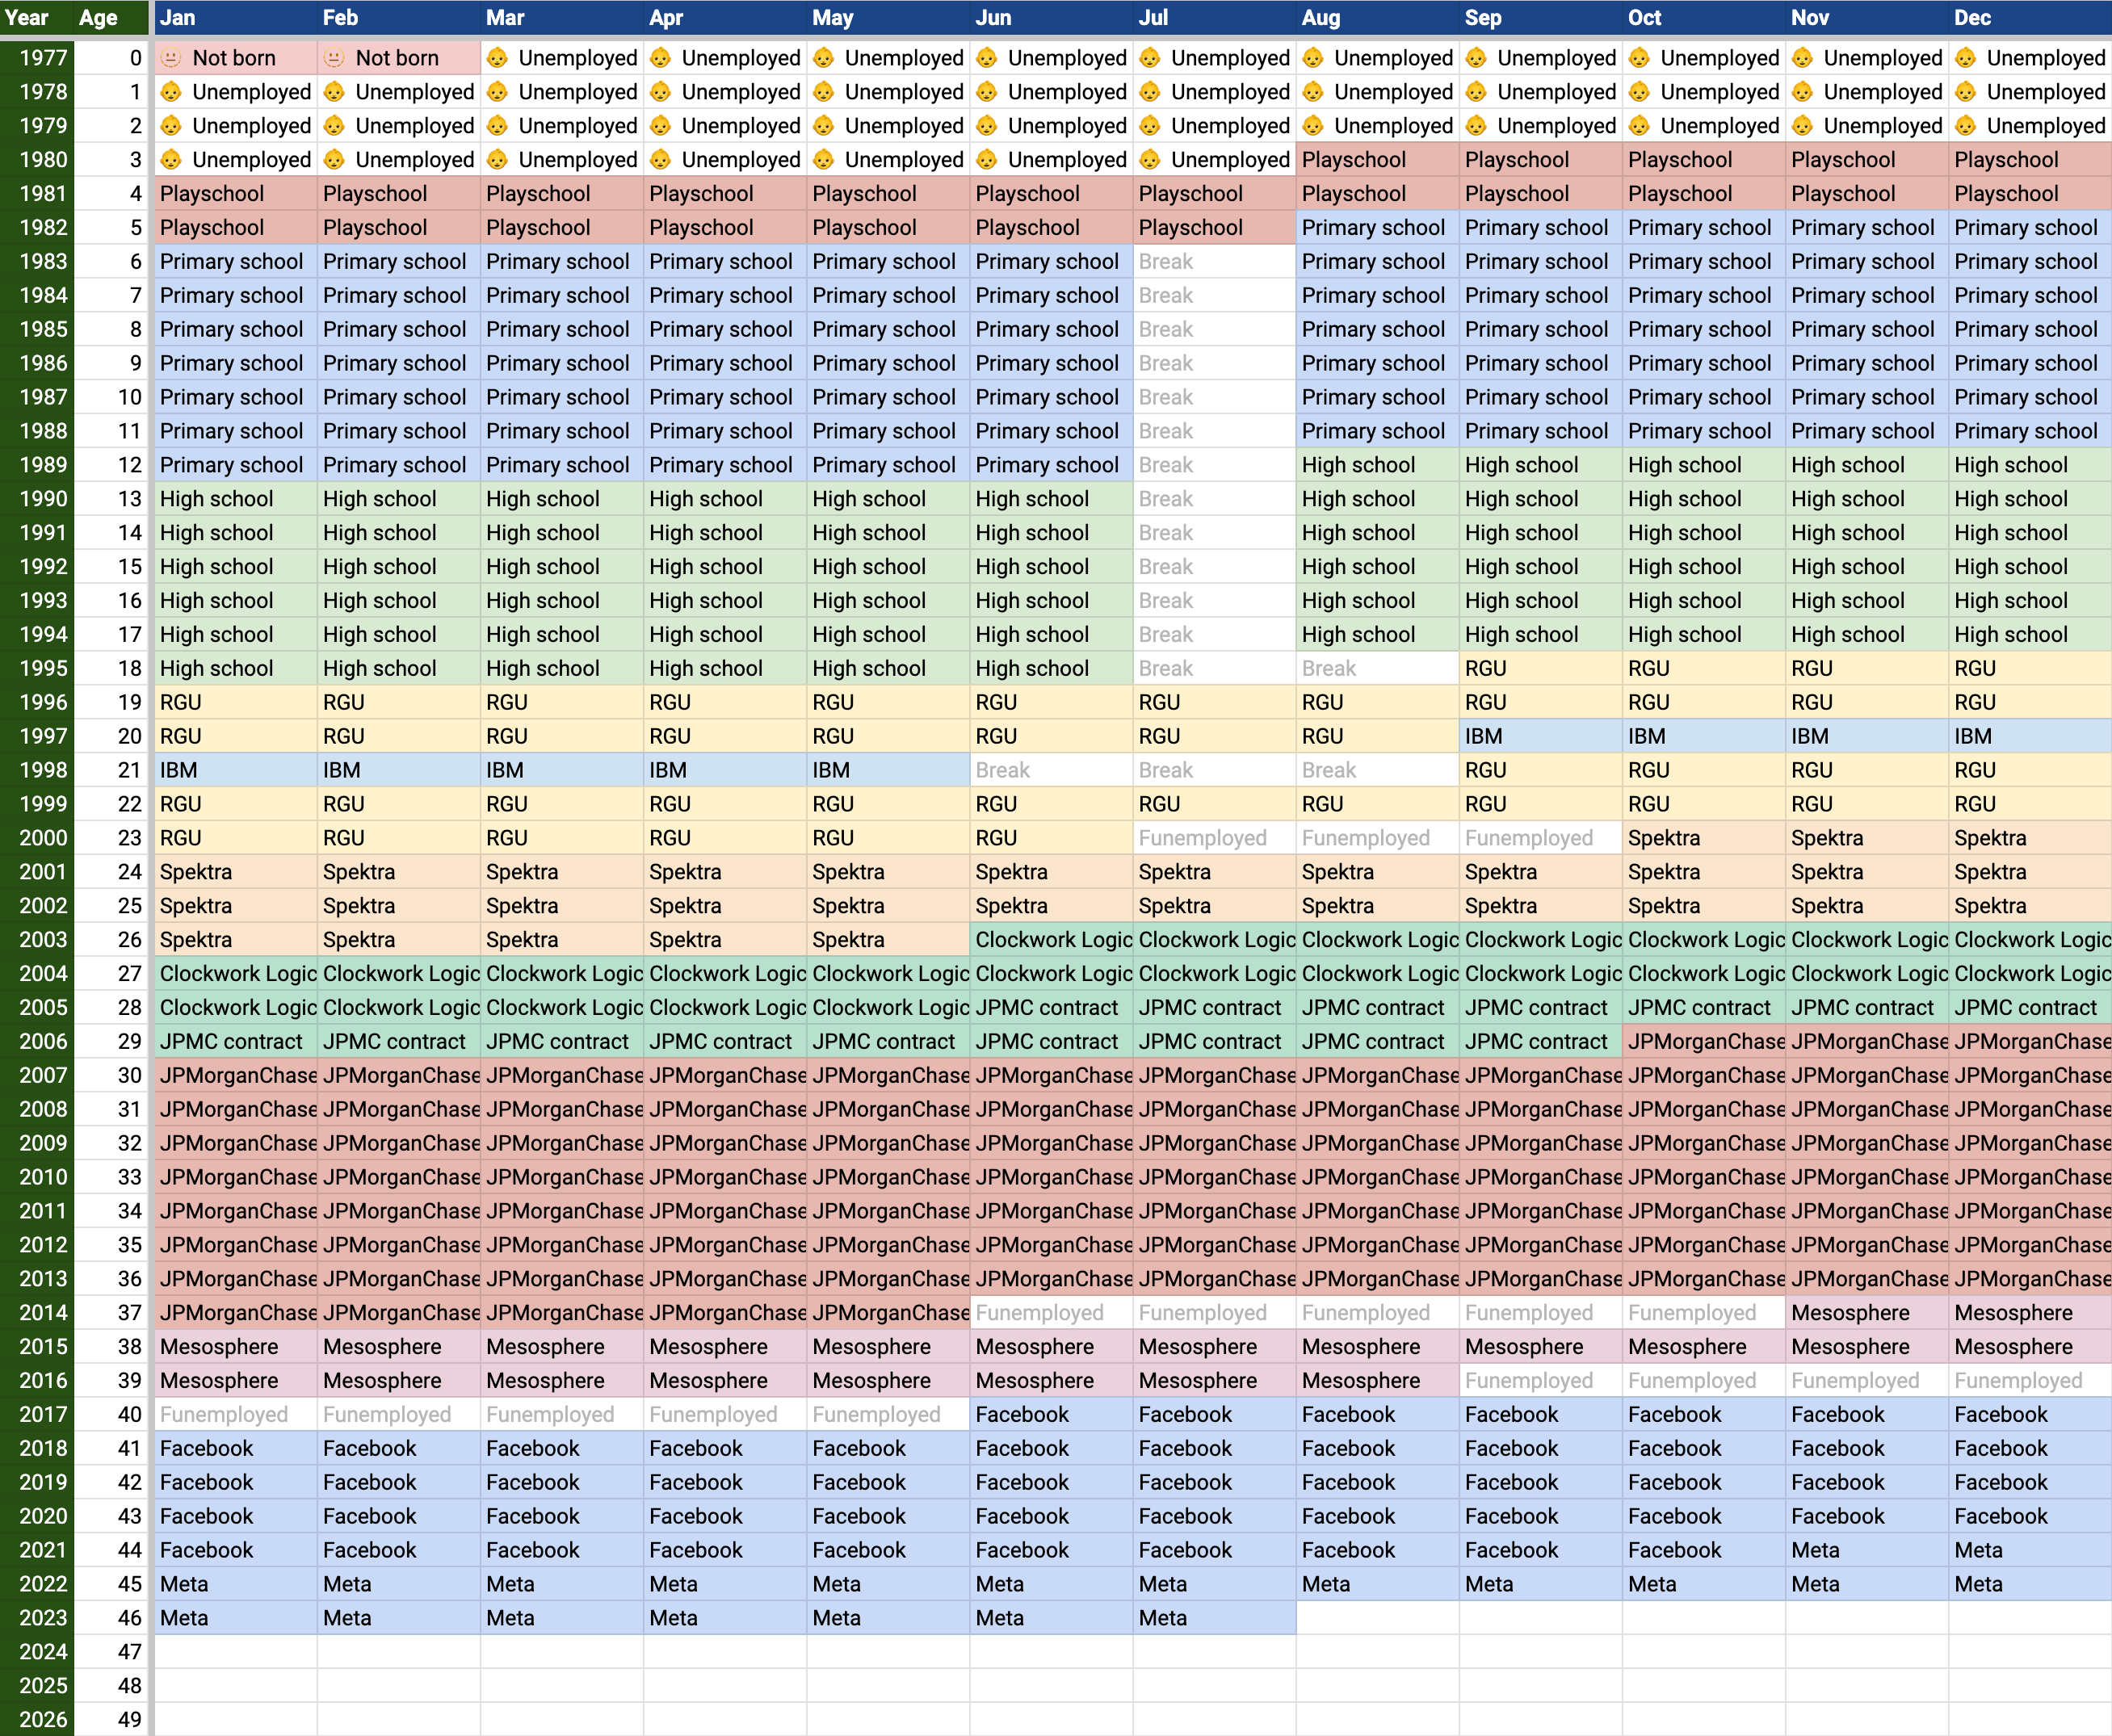
What this chart makes me think about:
- OK, Playschool is stretching it a bit for ‘career’.
- I don’t think I appreciated that Primary School runs longer than High School.
- There’s that internship at IBM Hursley Park poking out of my University time. While I was there, it was offhandedly suggested that I learn this new language, Java. The latest version, 1.1 was fresh and someone had to write a test suite for something called WebSphere. That offhand comment changed my whole career path.
- 50 feels oppressively imminent in this picture for some reason.
4. Your relationships
These are really interesting continuous events! I’m not posting my own on the internets 😅 but I recommend you try this for yourself. Does your chart show mostly one colour, or lots, or neither?
In my chart, I was surprised to see how certain relationships that felt long – or short – actually showed up, relative to everything else.
5. Military service
I recently finished researching my grandfather’s service record from the Royal Navy. This was a super simple way to visualize where he was posted between 1939-1952.
Each block represents his time posted to a different base, e.g. HMS Victory 2 in the beginning:
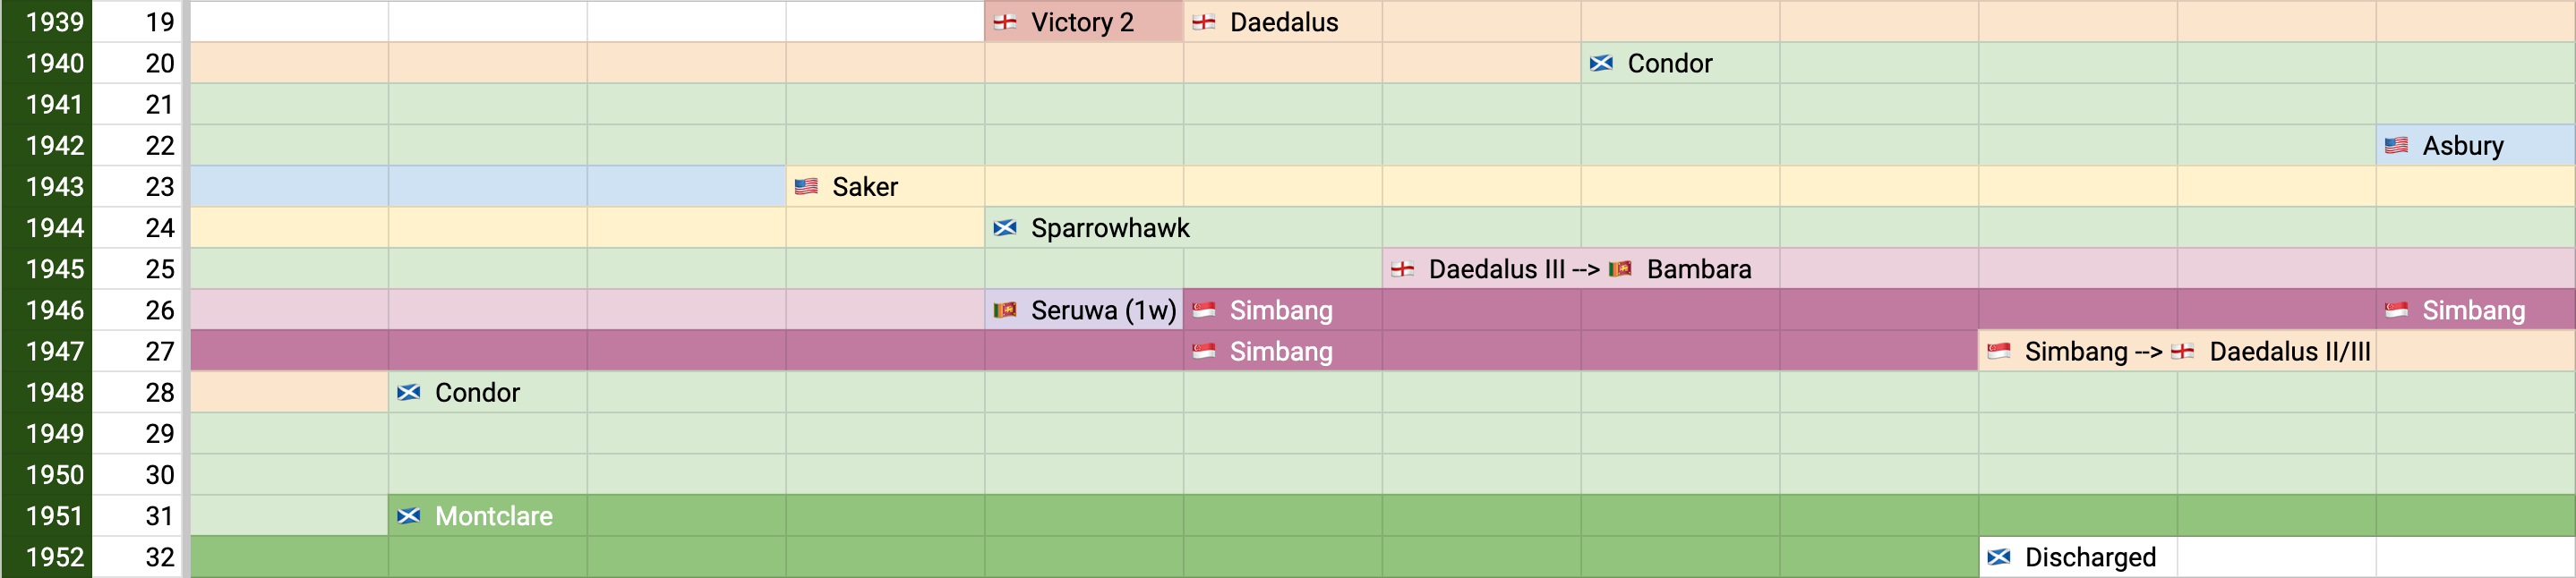
I couldn’t really grasp his journey around the world – the UK, USA, Sri Lanka, Singapore – until I put this picture together.
🟢 Make your own
What does this look like for your life?
Are you old enough to have accumulated a bunch of cells, colours on your journey? Are you young enough to feel good about the blank canvas – the branching paths – ahead of you?
I made a template version of this for you to try:
Steps:
- Open the template.
- Click
File…Make a copyto create your own (assuming you’re signed into Google). By default nobody else can see your new document – check theSharebutton at top-right to verify this. - Fill in your birth year in the yellow cell. There’s no other cleverness in the sheet – it’s up to you to fill in and style.
Notice there are multiple tabs for different subjects.
Have fun visualizing!
Contribute to this article
Leave a comment below:
- If you think of a good subject to track in your own life.
- What other visualization of lifetimes have you seen? I’d love to learn about them.